
“Debug WordPress: A Comprehensive Guide for Beginners” is your roadmap to becoming a proficient WordPress troubleshooter.
WordPress, the world’s most popular content management system (CMS), empowers millions of websites and blogs across the internet. While its user-friendly interface and extensive plugin ecosystem make it accessible to beginners, even the most well-maintained WordPress sites can encounter issues and errors. This is where the art of debugging comes into play.
In this in-depth exploration, we will demystify the debugging process, equipping you with the essential tools, techniques, and knowledge to identify and resolve issues in your WordPress website.
1. Understanding the Debugging Process
 Debugging is the process of identifying, analyzing, and fixing errors or bugs in computer programs, software applications, or electronic systems. The term “bug” originally referred to actual insects or foreign objects that could disrupt the proper functioning of early electromechanical and electronic systems. Today, it’s used metaphorically to describe any unexpected problem or flaw in software or hardware.
Debugging involves the following key steps:
Debugging is the process of identifying, analyzing, and fixing errors or bugs in computer programs, software applications, or electronic systems. The term “bug” originally referred to actual insects or foreign objects that could disrupt the proper functioning of early electromechanical and electronic systems. Today, it’s used metaphorically to describe any unexpected problem or flaw in software or hardware.
Debugging involves the following key steps:
Identification:
The first step is to recognize that there is an issue or problem in the system. Users, testers, or developers may encounter unexpected behavior, errors, crashes, or other indications that something is not working as intended.Reproduction:
The problem needs to be reproducible, meaning it can be consistently triggered or observed. Reproducing the issue helps in understanding its scope and characteristics.Isolation:
Isolating the problem involves narrowing down its cause. It often includes identifying the specific code, component, or subsystem where the issue originates. This step helps prevent unnecessary changes to unrelated parts of the system.Diagnosis:
Once isolated, the issue is examined in detail to understand why it occurs. This may involve reviewing code, logs, error messages, and system behavior. The goal is to identify the root cause or causes of the problem.Resolution:
After understanding the cause of the problem, developers or engineers work on finding a solution. This could involve modifying code, changing configurations, updating software components, or applying patches.Testing:
The proposed solution is tested to ensure that it effectively addresses the issue without introducing new problems or side effects. This includes unit testing, integration testing, and sometimes user acceptance testing.Verification:
Once the solution is implemented and tested, the system is verified to confirm that the issue has been resolved. Users, testers, or automated checks can be used to validate the fix.Documentation:
It’s essential to document the debugging process, including the problem’s description, steps to reproduce, root cause analysis, and details of the resolution. Documentation helps in knowledge sharing and can be valuable for future reference. Debugging is a critical skill for software developers, system administrators, quality assurance professionals, and anyone involved in software development or maintenance. It requires a methodical and analytical approach to identify and resolve issues efficiently, ensuring that software and systems function correctly and reliably.2. Enabling Debugging in WordPress
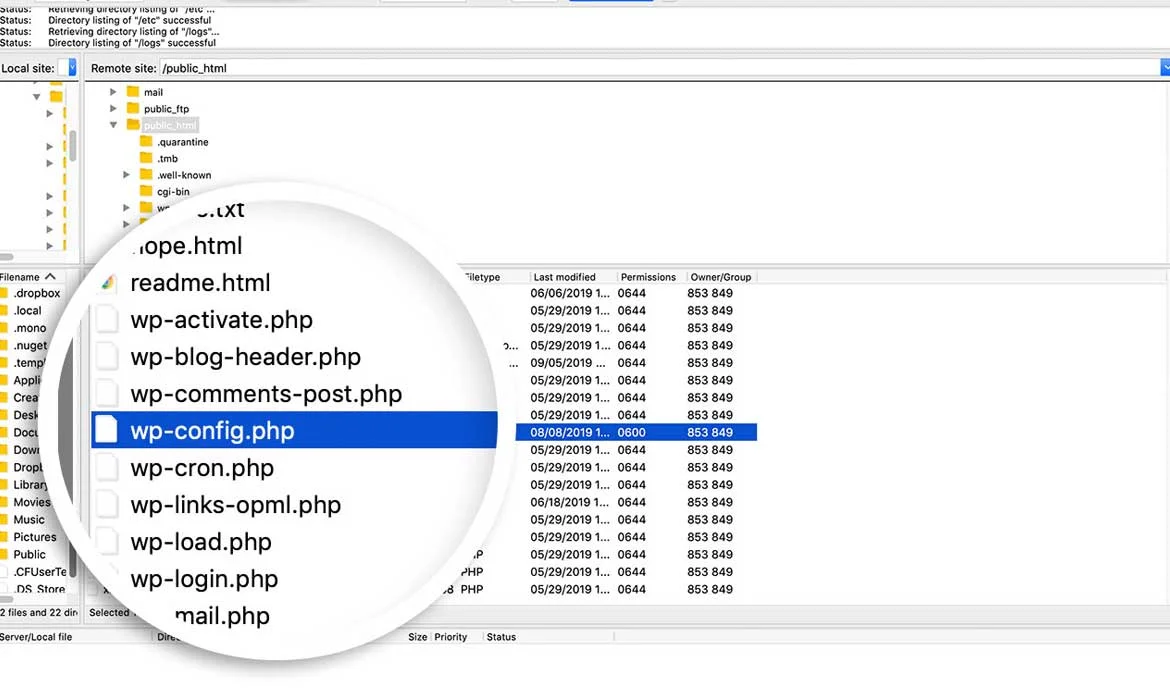 WordPress offers a built-in debugging feature that helps identify issues. To enable it, add the following lines to your wp-config.php file:
define('WP_DEBUG', true);
define('WP_DEBUG_LOG', true);
define('WP_DEBUG_DISPLAY', false);
@ini_set('display_errors', 0);
WP_DEBUG:
This constant, when set to true, turns on debugging mode. It means WordPress will display PHP errors and warnings on your site.WP_DEBUG_LOG:
When set to true, this constant instructs WordPress to log errors and warnings to a file called debug.log within the wp-content directory. This is helpful for capturing errors without displaying them to your site’s visitors.WP_DEBUG_DISPLAY:
Setting this to false prevents errors and warnings from displaying on your site. It’s essential to keep this off on production sites to avoid exposing errors to visitors.@ini_set(‘display_errors’, 0):
This line further ensures that PHP errors won’t be shown to site users.3. Common Debugging Tools
 Debugging requires the right tools. Here are some common ones:
Web Browser Developer Tools: Every major browser (Chrome, Firefox, Safari, Edge) offers developer tools. You can inspect HTML, CSS, and JavaScript, check network requests, and view JavaScript console messages for errors.
FTP Clients: Tools like FileZilla or Cyberduck help you access your website’s files. They are invaluable when you can’t access the WordPress admin area due to an issue.
Text Editors and Integrated Development Environments (IDEs): These include Visual Studio Code, Sublime Text, and PhpStorm. They provide code highlighting, autocompletion, and debugging features.
Query Monitor: Query Monitor is a popular WordPress plugin that provides detailed information about database queries, hooks, HTTP requests, and more. It helps identify slow queries, performance bottlenecks, and compatibility issues with themes and plugins.
Debug Bar: Debug Bar is another useful plugin that adds a debug menu to your WordPress admin bar. It displays information about database queries, PHP errors, hooks, and more in a convenient interface. It’s especially handy for developers and administrators.
Health Check & Troubleshooting: This built-in WordPress tool (found in the dashboard under “Tools” > “Site Health”) helps diagnose common configuration issues and provides recommendations for resolving them. It also offers a troubleshooting mode, allowing you to disable plugins and themes to identify conflicts.
Log Deprecated Notices: This plugin, when activated, logs the use of deprecated functions and features in your WordPress site. It helps you identify code that may need updating to ensure compatibility with the latest WordPress versions.
User Switching: While not strictly a debugging tool, the User Switching plugin allows you to easily switch between user accounts on your WordPress site. This can be helpful for testing and debugging user-specific issues.
Error Log Viewer: Some hosting providers offer an error log viewer in their control panels. This tool allows you to view and analyze server-side errors and issues that may not be caught by WordPress-specific debugging.
Third-Party Hosting Debugging Tools: Many hosting providers offer their own debugging and monitoring tools tailored to their hosting environments. These tools can help you diagnose server-related issues and optimize site performance.
4. Debugging Techniques
a. Debugging with echo and print_r:
These functions are simple yet effective for displaying values and variables during debugging. For instance:$my_variable = 'Hello, Debugging!'; echo $my_variable;In this example, the variable’s value will be printed on the screen.
b. Using error_log:
The error_log function is an excellent alternative to echo when you want to log messages without affecting your site’s appearance. For example:
error_log('This is a debug message.');
The message will be recorded in the PHP error log, which can be accessed through your server’s control panel.
c. WP_DEBUG and WP_DEBUG_LOG:
By enabling WP_DEBUG and WP_DEBUG_LOG in your wp-config.php file, you gain access to detailed debugging information in the wp-content/debug.log file. This file logs PHP errors, warnings, and notices, making it a valuable resource for identifying issues.5. Debugging Plugins and Themes
Plugins and themes can be sources of conflicts and errors. When debugging, follow these steps:- Deactivate plugins one by one and test your site to see if the issue persists. This helps identify problematic plugins.
- Switch to a default WordPress theme (e.g., Twenty Twenty-One) to determine if the issue is related to your current theme. If the problem disappears with the default theme, your theme might be the cause.
6. Identifying and Fixing PHP Errors
PHP errors can range from simple syntax issues to complex runtime errors. Be vigilant about checking your PHP code for:Syntax errors:
These are often due to typos or incorrect use of PHP syntax elements.Undefined variables:
Using variables before defining them can cause errors.Fatal errors:
These can result from incorrect function or method calls, such as calling a non-existent function. Debugging functions like var_dump and print_r can be used to inspect variables and identify issues.7. Troubleshooting Database Issues
Database issues can lead to various problems in WordPress. Here are some common database-related debugging steps:- Check your wp-config.php file to ensure database credentials are correct. Incorrect database settings can prevent your site from functioning correctly.
- Use the WP_DEBUG mode to spot database errors. These can include connection issues or SQL query errors.
8. Handling HTTP Errors
HTTP errors, such as the infamous 404 “Not Found” error, can disrupt your website’s functionality. To address these issues:- Use redirection plugins to handle broken links and guide users to relevant content.
- Regularly check for broken links on your site using online tools or plugins.
9. Performance Optimization through Debugging
Performance optimization is the process of improving a website’s speed, responsiveness, and efficiency. A faster website provides a better user experience, helps with search engine rankings, and can lead to higher user engagement and conversions. Debugging, traditionally associated with finding and fixing errors, can also play a significant role in optimizing a website’s performance. Here’s how:Identifying Slow Queries:
What it means:
A slow query refers to a database query that takes an unusually long time to execute. These queries can significantly slow down your website’s loading times.Debugging’s role:
Through debugging tools like Query Monitor (a WordPress-specific example), you can identify slow database queries. By pinpointing the exact queries causing delays, you can work on optimizing them. This may involve adding indexes, fine-tuning SQL statements, or caching query results.Finding Resource-Intensive Plugins:
What it means:
Plugins are extensions that add functionality to your WordPress site. Some plugins can be resource-intensive, consuming a lot of server resources and causing slow page loads.Debugging’s role:
Debugging can help you identify which plugins are slowing down your site. By deactivating them one by one and monitoring your site’s performance, you can determine which plugins are resource hogs. Once identified, you can choose to optimize, replace, or remove them.Detecting Other Bottlenecks:
What it means:
Bottlenecks are points in your website’s architecture or code where performance is constrained or limited. These can include inefficient code, excessive HTTP requests, large images, or server configuration issues.Debugging’s role:
Debugging allows you to pinpoint these bottlenecks. For instance, using browser developer tools, you can check network requests, analyze JavaScript execution, and inspect CSS rendering. Server-side debugging tools help you identify issues related to code execution, database queries, and server configuration. Once identified, you can take steps to optimize or resolve these bottlenecks, which can have a direct impact on site speed.10. Best Practices for Safe Debugging
 Debugging can sometimes involve making changes to your website’s code or configuration. To ensure a safe debugging process:
- Backup Your Website: Before making any changes, always create a backup of your website. This ensures that you can revert to a working version if something goes wrong.
- Use a Staging Environment: For extensive debugging or testing of major changes, set up a staging environment that mirrors your production site. This allows you to experiment without affecting the live site.
- Remove Debugging Code: Once you’ve identified and fixed the issue, make sure to remove any debugging code or modifications you made to the site’s code. Leaving debugging code in place can introduce security risks and unexpected behavior.
Debug WordPress FAQ
1. What is WordPress debugging?
WordPress debugging is the process of identifying, isolating, and resolving issues or errors in a WordPress website’s code or configuration. It helps ensure that the website functions correctly and efficiently.
2. How can I enable debugging in WordPress?
To enable debugging, add the following lines to your WordPress wp-config.php file:
define('WP_DEBUG', true);
define('WP_DEBUG_LOG', true);
define('WP_DEBUG_DISPLAY', false);
@ini_set('display_errors', 0);
These settings turn on debugging, log errors to a debug.log file, and prevent errors from displaying on the site.
3. What is the debug.log file in WordPress?
The debug.log file is where WordPress logs errors, warnings, and notices when debugging is enabled. It’s located in the wp-content directory of your WordPress installation and contains valuable information for troubleshooting.
4. How can I view the debug.log file?
You can view the debug.log file by accessing it directly via FTP or a file manager in your hosting control panel. Alternatively, some plugins and hosting environments provide built-in log viewers.
5. What are common WordPress debugging tools?
Common debugging tools for WordPress include Query Monitor, Debug Bar, and error log viewers in hosting control panels. These tools help developers identify issues with queries, plugins, themes, and more.
6. How can I identify slow queries in WordPress?
You can identify slow database queries in WordPress by using plugins like Query Monitor or by enabling debugging and examining the debug.log file for queries that take an unusually long time to execute.
7. What should I do if a WordPress plugin is causing issues?
If a plugin is causing issues, you can deactivate it temporarily to see if the problem goes away. If it does, you can contact the plugin’s developer for support or look for alternative plugins that provide similar functionality.
8. How can I optimize my WordPress website through debugging?
To optimize performance through debugging, start by identifying and resolving slow queries, resource-intensive plugins, and other bottlenecks. Additionally, use debugging tools to analyze and improve code efficiency, reduce HTTP requests, and address server configuration issues.
9. Is it safe to debug a live WordPress website?
Debugging a live WordPress website should be done with caution. It’s recommended to use a staging environment or create backups before enabling debugging or making significant changes to avoid disrupting the live site’s functionality.
10. Are there WordPress hosting providers that offer debugging support?
Some WordPress hosting providers offer specialized support for debugging and troubleshooting WordPress websites. They may provide tools, guidance, and assistance to help you resolve issues efficiently. These frequently asked questions cover essential aspects of debugging WordPress websites. Debugging is a crucial skill for WordPress developers and administrators to maintain a healthy and efficient website.
Conclusion
Congratulations, you’ve reached the end of WordPress Debug: A Comprehensive Guide. You’ve embarked on a journey from the basics of understanding the debugging process to mastering essential tools and techniques for troubleshooting your WordPress website.
By now, you’ve learned that debugging is not merely about fixing errors but about developing a structured problem-solving approach. It’s the skill that transforms you from a WordPress user to a WordPress expert who can keep a website running smoothly.
Master WordPress Debugging Like a Pro
Using well-coded WordPress themes like Miion, Gigas, Seoaal, and Digion minimizes errors and makes debugging easier thanks to clean code, compatibility with the latest WordPress updates, and built-in performance optimizations.